A Device to Help Me Sleep Better
At my old house, I used to live next to some railroad tracks.
And by "next to", I mean it was a measured 48 feet from my bedroom window to the rail. On the only north-south freight rail line in central Oregon. Trains were frequent - around eight passed by daily, including (typically) three between the hours of 11PM and 6AM.
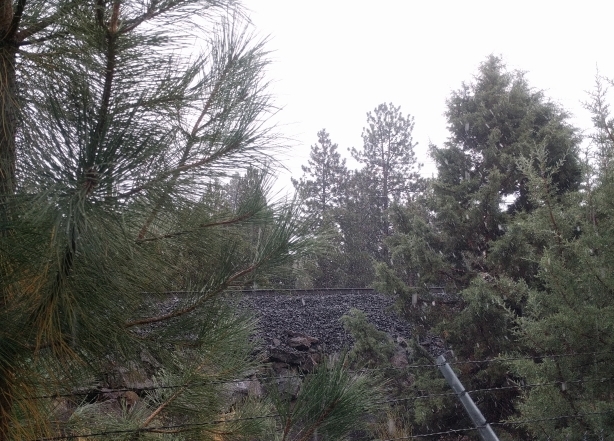
The view from the window, mid snow shower
Fortunately, I'm a deep sleeper, and it didn't really bother me as long as I kept the window shut. I was quite happy sleeping here for nearly two years.
The Issue
But then, I got married, and unlike me, my wife is not a deep sleeper. She was being constantly woken up by trains, and so what sleep she did get was poor in quality. Repeat for a month, and she was fairly unhappy.
So I grabbed one of the (many) spare Raspberry Pis I had lying around, hooked it up to some $5 thrift store speakers in our bedroom, and set the Pi to play pink noise constantly. We would turn on the speakers before bed, and turn them off in the morning. The speakers even had a remote control, so no need to get up if we forgot to turn it on before getting in bed.
And it worked! Mrs. Wife slept like a rock. Train noise successfully drowned out.
Just one problem: the minimum speaker volume necessary to drown out passing trains was significantly louder than the maximum volume at which I could easily fall asleep. One person slept easy, and the other did not, just like before.
So I thought to myself - "Wouldn't it be nice if I had some way of knowing when a train was coming, so I could raise the volume to drown it out, but keep the noise quiet otherwise?"
I started brainstorming ways to do this. Some ideas that came to mind:
- A train schedule
- Radio Signals
- Railroad Crossings
- Laser Microphone
- Non-laser Microphone
The trains most readers are familiar with, probably claim to run on some sort of schedule. Those who ride them often in the United States are probably also familiar with how often they actually abide by that schedule; rarely if ever. And this is purely a freight line, where running trains at a given time is optional and frequently plus-or-minus several hours, not to mention that BNSF was free to run bonus 2am trains whenever they felt like it. And of course, freight train location data is considered information of national security importance, so no freight company publishes it or will give it out when asked.
Trains use radios to communicate with their stations, and BNSF trains transmit telemetry data at around 44Mhz. Hypothetically I could listen for these radio blasts, and indeed they are commonly used in the railfan community to know when trains are nearby. But some unfortunate realities made this difficult for our purposes. There were multiple switching yards nearby, so the presence of many trains that were not necessarily on the track going past our house would confound the signal. Furthermore, the trains had a very unfortunate habit of stopping on the tracks outside our house, and not moving again for up to 20 minutes. With the transmitter potentially up to a mile away at the head of the train, a radio system would not know the railcars were still outside the window and would happily assume there was no train through the racket the railcars made once they started moving again.
There are railroad crossings at major roads about a half mile in both directions from the house. This had the potential to be very useful - if I could somehow discern the state of the two crossing gates, then as long as at least one was closing/closed, I could ramp up the volume and keep it high, otherwise keeping it low.
Unfortunately, I did not have line-of-sight to either crossing, even from my roof. Without being able to see the crossings, the only way to determine their state would be to place hardware somewhere near (or on) the crossing, which came with a whole host of problems. Not only would the device would have to be powered, but someone would be able to steal it (as it wouldn't be anywhere close to on my property), it would have to send information a half mile away to my house, and of course it had the potential to land me in prison if I tampered with the crossing in any way.
Having read several articles and books on the Cold War and the history of spycraft, I was familiar with a device called a laser microphone, which allows someone to measure the vibrations in a distant object by bouncing a laser beam off of it and measuring movements of the reflected light beam. The rails are conveniently located at window height, so this would be feasible. Increased vibrations in the track would indicate a train approaching.
Unfortunately, the tracks are not themselves sufficiently reflective for this to natively work. A mirror would have to be physically affixed to the side of the track, about which I am sure BNSF would not be thrilled if they found (and it would be pretty obvious who put it there). Add to that the loss of sensitivity whenever it rained or snowed, and of course the risk of hanging somewhat expensive electronics equipment out my window, and this wasn't looking like a great option either.
I considered just dangling an ordinary microphone out the window to listen for the engine rumble and the whistle that blew at the train crossings. But like the laser microphone above, this would be susceptible to the weather - wind at the wrong time could prevent a train detection, water or insects could get in and destroy the equipment, and it still meant that I had to run wires through my wall or window to the outdoors. Putting the microphone indoors would solve those problems, but might not be able to hear an approaching train far enough in advance to slowly ramp up the volume before it arrived.
The Solution
As I was pondering ways to make a laser microphone work while having all equipment contained within my house, a train went by, a particularly loud one that shook the house for a minute or so. I realized - there was no need to look outside at the rail for vibrations of an approaching train, I could do so right within my own home, picking up the shaking of the earth caused by the approach of ten million pounds of high-speed steel. Each train that went by created a very small localized earthquake - and so I would make a seismograph.
Searching online for "homemade seismograph" yields numerous results and dozens of very different and creative designs of various difficulties, costs, and sensitivities. Some made creative use of springs, while others simply used accelerometers. I finally settled on a GPL'd design that suspended a magnet on a long lever arm next to a coil of wire - vibrations would shake the arm, inducing a current in the coil. It even included a vibration damper based on Lenz's Law, so after an initial shock oscillations would quickly dissipate on their own.
Seismograph Body Construction
Creating the body was simply a matter of cutting some foam board and applying a hot glue gun. I bought a thin iron rod to use as the needle arm, as well as several neodymium disk magnets, from a home improvement store. I wound some 28 AWG enameled wire around a small, flat plastic spool to create my coil. I cut a thin strip of brass to hold the coil over the magnets. On top of the brass, under the coil, I put a 1/8" thick plate of aluminum I made by cutting a much longer aluminum strip, and on top of the coil I put a small piece of steel to attract the magnets mounted on top of the rod, to hold that assembly upright. For anyone looking to make their own, the only measurement that really matters is to make the height of the structure about an inch taller than the length of your needle, to give room for your magnets. Everything else should be pretty self-explanatory from the above link.
Once the assembly of the above was done, I created a cage for the whole thing to protect it from air currents. I twisted several lengths of annealed wire into a wireframe box significantly larger than the device, and then wrapped the whole thing in clear kitchen plastic wrap, sealing the holes with duct tape. I soldered some jumper wires to the free ends coming off the coil, and the device was done.
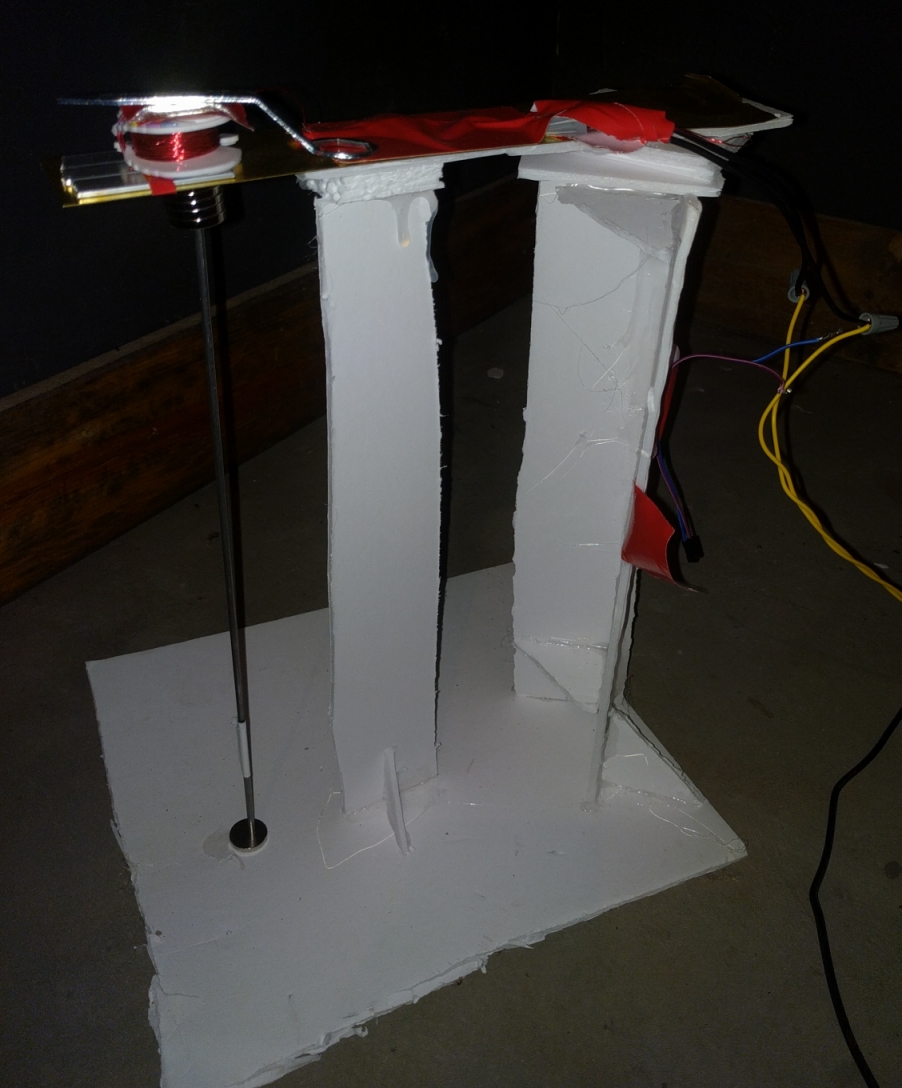
The completed seismograph, without the enclosure
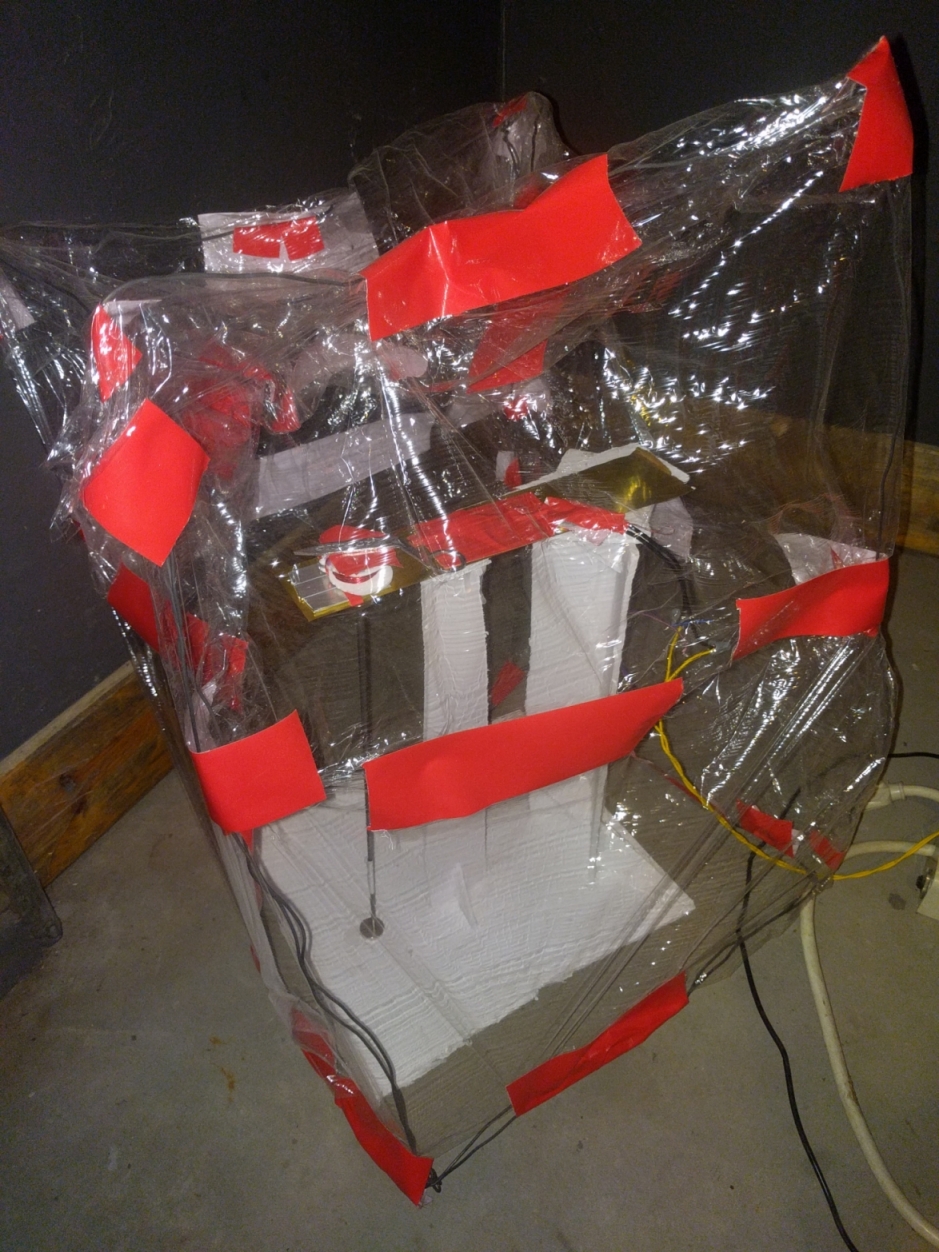
The completed seismograph, with the air current enclosure
Of course, building the physical device to pick up the vibrations was only half of the task - and, it turned out, by far the easier one. Next, the tiny signals from the movement of the magnet needed to be amplified so I could pick them up and process the signal.
Despite my constant tinkering, I am not an electrical engineer. Not even close - it's at best a Halloween costume on me. I have a general idea of what resistors, capacitors, and transistors are, and I'm semi-competent with a soldering iron, but that's about as far as it goes. The most complex projects I've done before are 1) programming a micro maestro to actuate a servo when a button was pressed, and 2) rewriting some firmware for a different version of a circuit board of mine with a PIC12F635 microchip, tracing the circuitry with a multimeter to determine what each pin was connected to. I had never undertaken any large-scale soldering project, nor designed my own PCB or any complicated circuit. There was a lot of learning to do before electrical engineering seemed more like science and less like black magic.
Some Brief EE Background Follows
I learned there are devices called operational amplifiers, or op amps, which are key to building amplification circuits. These are chips which have an "inverting" and a "non-inverting" input, as well as an output, and put simply, making the inverting input more negative makes the output more positive, and making the non-inverting input more negative makes the output more negative. These are enormously useful for a wide variety of electronics applications, and there are all sorts of different neat circuits you can make with them. The one I was interested in is called a non-inverting amplifier, which takes a small voltage and turns it into a comparatively larger one. Here's how these are wired:

These amplify based on the ratio of the values of the two resistors - the exact formula is (1 + (R2/R1)). In other words, if R2 is a 1000 ohm resistor, and R1 is a 100 ohm resistor, then the circuit will amplify the input 11x.
Slight tangent - there's actually a bit of a dearth of information about these circuits on the internet, in my opinion. Doing a search for op amps and non-inverting amplifiers will yield enormous quantities of websites describing how they work - in other words, describing that 1 + R2/R1 formula I described, and then hand-wave the why with some anthropomorphizing like "The op amp wants to keep the two input voltages the same" as if that explains why the amplification is equal to the ratio of the two resistors. Perhaps it does to someone with a more extensive electronics background, but as a lay person, I found it very unsatisfying. For anyone else who is curious to understand why the amplification is determined by the resistor ratio, here is the best site I found with an easily-digestible explanation.
My First Amplifier
I ordered some op amps, and was told they would arrive in just a few short weeks, which was longer than I wanted to wait before being able to even begin building my amplifier. So in the meantime, I started looking for unused devices I might have with op amps that I could cannibalize to experiment with in the meantime. I found a few soil moisture sensors that I ordered years ago and never used, which had LM393 op amps wired up in a voltage comparator configuration. Some time with a multimeter let me figure out which pin was connected to what, and it turned out the crucial inverting input pin was connected to a potentiometer, which would connect it to either the ground or a 5v source, which was not terribly useful - so I pried off the potentiometer, and attached a jumper cable to the pin that once held it on.
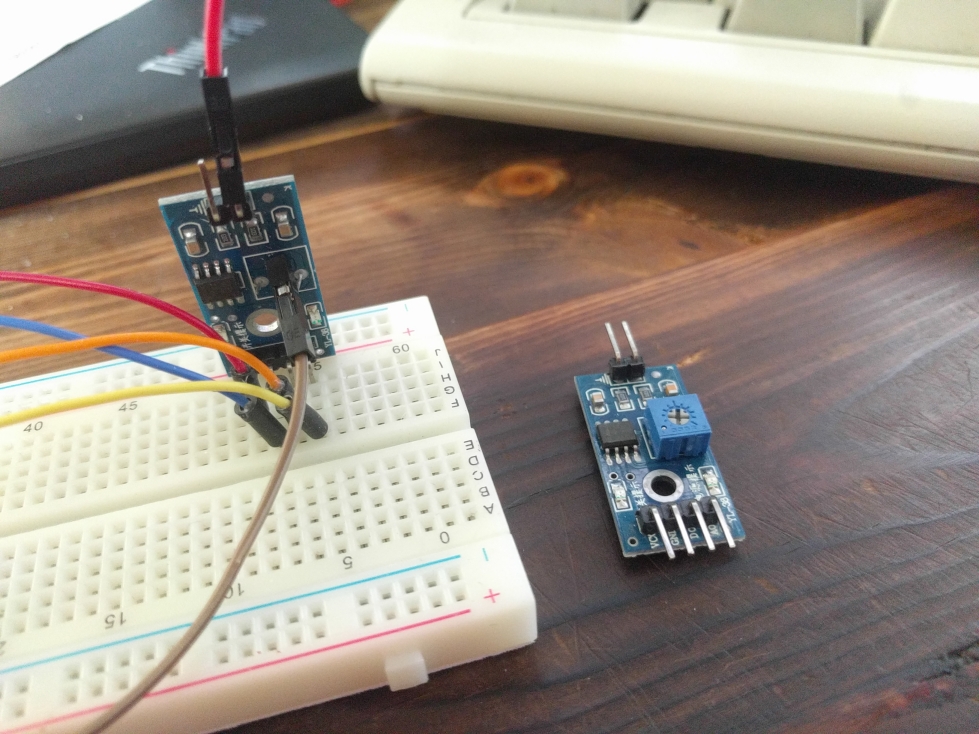
A cannibalized moisture sensor, with an undamaged one on the table
Reading The Data
Now I needed something to take this amplified change in voltage, and change that into a number on a computer somewhere that I could use to make decisions about "Train" or "No Train". My Arduino Uno has an analog input pin, so I started out hooking everything up to that, then plugged the Uno into the computer and printed the analog input to the terminal 10x per second. I had my first end-to-end physical prototype - reading the numbers off of the screen, I could observe large oscillations in the numbers when tapping my foot on the ground near the seismograph.
For the final product, the Arduino wouldn't cut it, though - it has no network capability, so no ability to ssh into the noise Pi and adjust volume levels. While Arduino shields exist to provide this ability, I didn't have one, and I was really looking for something to do with my other spare Raspberry Pis. The idea of having everything running on an easily accessible and adjustable Linux platform also appealed to me. Unfortunately, Raspberry Pis do not have analog inputs - all pins are digital only. But there are many different expansion hats made for the Pi, including this one, which adds a microphone input. I acquired one of these, chopped the wires on a cheap set of headphones, and attached the former headphone jack to the amplifier output. I was now able to visualize and record the signals from the seismograph as sound data on the Pi, using Audacity.
Other Pitfalls
Along the way, I found a number of other issues that would need to be resolved before the final version. First, I learned what ground loops are, and discovered that I had inadvertently created several, generating a truly astonishing amount of noise in the amplifier. Second, I learned that different sources of power for the op amp created radically different quantities and patterns of noise - running the op amp off of a USB port on my desktop caused it to behave differently than running it off my laptop USB, or an outlet USB adapter (easily the worst for noise), or off of the 5v rails on the Arduino or Raspberry Pi. I even tried running the input through a 5V voltage regulator from Pololu that I had lying around, to minimal success. So, I started researching low-noise ways to build my final amplifier.
A Low-Noise, High Performance Amplifier
After some research, I learned that it's useful to provide op amps with symmetrical voltage - that is, rather than providing -5V and a ground, it is preferable to provide -5V and +5V. The reason for this is that the op amp can only push its output voltage as high or as low as its input rail voltages. For example, if I feed the op amp -5V and 0V, and my signal input starts at 0V, and if I have an oscillating input - which I do - then when the signal input goes down to -0.1V, the op amp might output -4V (for example), but if the signal input goes up to +0.1V, the op amp can only output 0V, not +4V. This is because the + input rail is at 0V. In other words, for an oscillating signal, it is useful for the voltage around which the input oscillates to be halfway between the two input voltages, and it is usually easier to provide -5V and +5V and have the input centered at 0V, rather than feed in 0V and -5V and center the input at -2.5V.
There exist circuits called low pass filters, which can also be made with op amps. These allow me to filter out high-frequency signals from the seismograph, which are likely to be some sort of unwanted noise or another - whether from the power supply, or air currents and voices, anything that's unlikely to be the very low-frequency ground rumblings of a far-off approaching train. I found someone had already designed a very elaborate, high-performance amplifier with all of these features, complete with schematics. I purchased the various components I would need - capacitors, resistors, and voltage regulators, along with the op amps that had finally come in, and got to work with my breadboard.
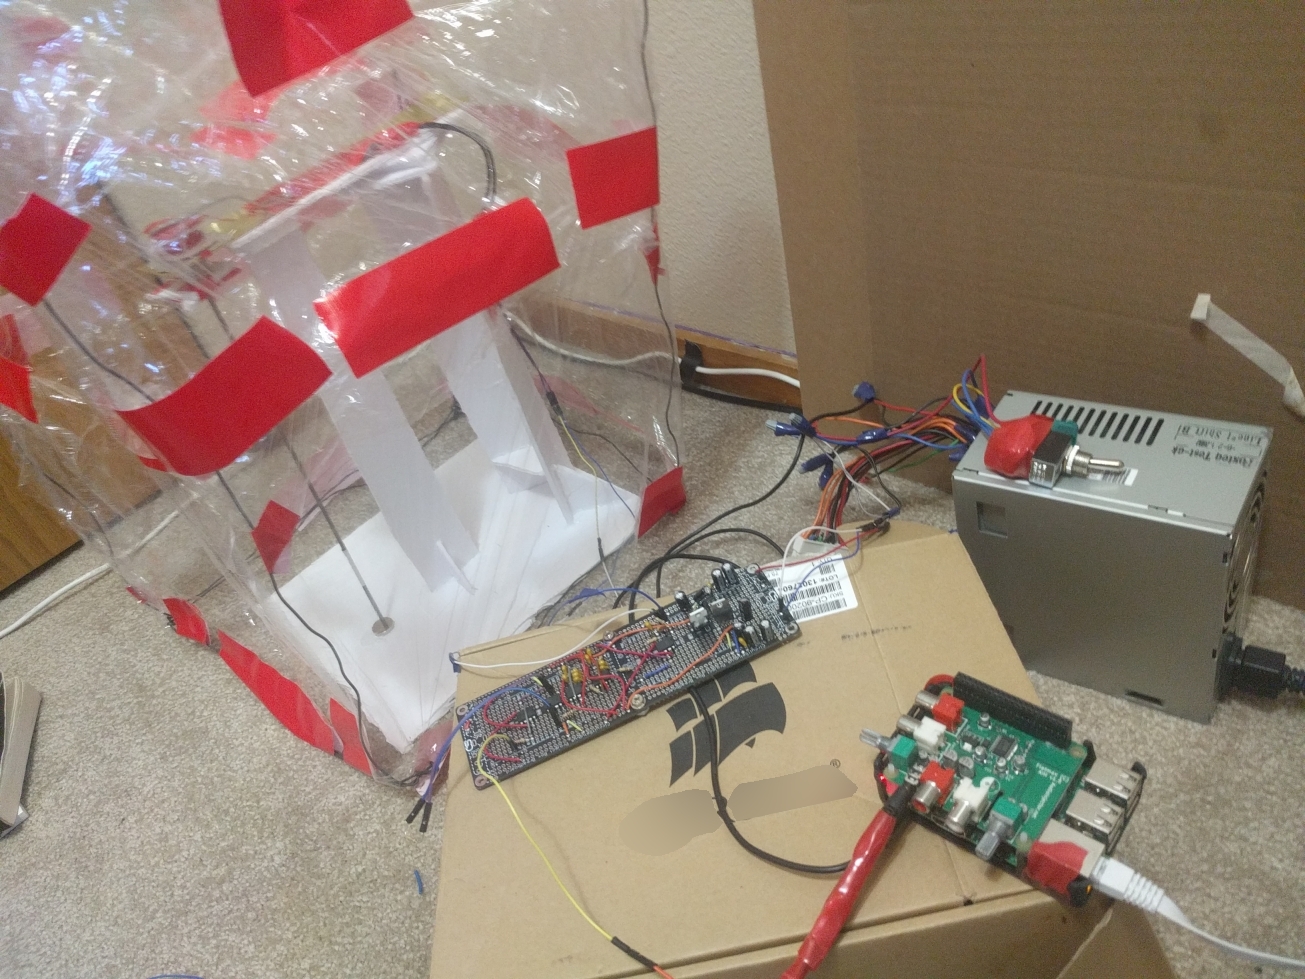
Symmetrical power supplies don't exactly grow on trees, and looking at dedicated PCBs to provide symmetrical power can be difficult if you haven't used them before and don't know exactly what you're looking for. So, instead of buying one, I repurposed an old desktop PSU I had had on the shelf for a couple years. On a desktop PSU, the blue motherboard wire supplies -12V DC, and the yellow motherboard wire supplies +12V DC. I cut the two wires out of the harness, attached them to jumper cables with wire nuts, and used them to supply the symmetric power to my breadboard. I then worked through all of the schematics in the high-performance amplifier linked above, laying out each piece on my breadboard, until I had a finished product. To the right in the photo is a switch I wired in to avoid having to plug/unplug the PSU every time I wanted to cut power to touch and move components.
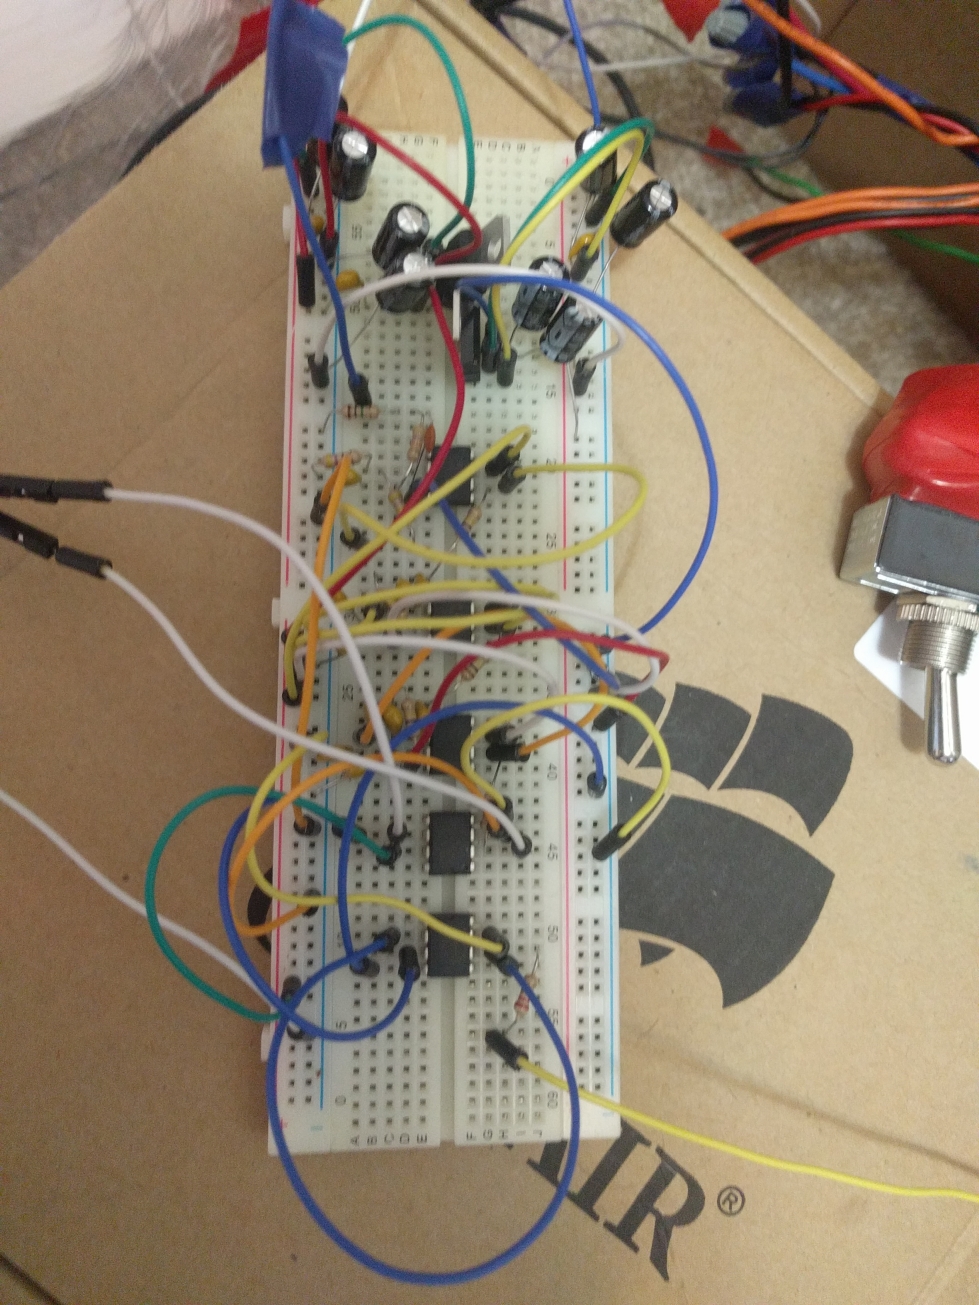
The completed, working voltage regulator and amplifier. The seismograph input comes in on the blue wire with painter's tape, and the amplified output leaves for the Raspberry Pi on the yellow wire to the bottom right. The pair of white wires leaving center-left connected to a resistor that I would swap out to change the amplification level.
The Last Piece
All physical components were now assembled, if in a breadboard prototype stage. All that remained was to write the software which would take the input data from the microphone, and make decisions about what to do with the volume of our pink noise. As a first step on this journey, I started recording from the Pi during the day every time I heard a train begin to approach, until after it was gone, so that I could have as many examples of train noise as possible. I also recorded several segments of relative silence, during which I moved as little as possible, to get an idea for the background noise. Then I began to write software to tell the two apart.
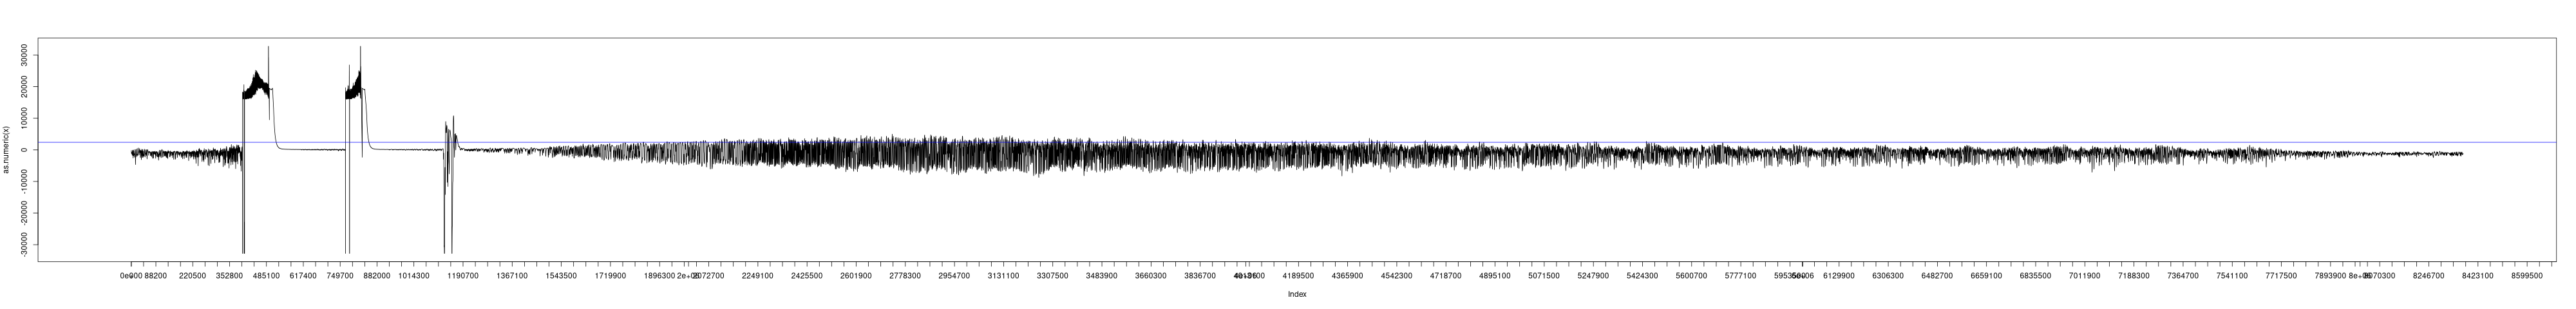
A recording of a train passing until I could no longer hear it. The artifacts near the beginning are a result of me bumping the instrument
I had a couple of criteria I was looking for in my methodology. It needed to be sensitive - the consequences of missing a train were high. It needed to be sufficiently specific that it would be quiet while we were trying to fall asleep. It needed to be computationally simple - the whole thing needed to run in real time on a Raspberry Pi, as a lag in processing could make the difference between having the volume raised in time or not. Bonus points if I could just stream the data rather than having to do any buffering or chunking.
I rejected a machine learning approach out of the gate - creating a training dataset would have been much too difficult. With such a limited number of trains each day, I would have to be there to record all of them - and not only the passing itself, but the minutes beforehand, as the idea was to detect the train long before it arrived, so the pink noise volume could be raised slowly rather than abruptly. So either I would have to be constantly alert for every distant train whistle, or I would have to sift through hours upon hours of recordings looking for trains, and being able to distinguish their waveforms from, say, a family member walking around the house.
My friend Nathaniel is an astrophysicist who studies the sun's corona, using magnetometers and I'm sure an array of other exciting scientific instruments. While magnetometers are not seismographs, he has a lot of experience with signal processing, so I looked to him for advice on how to approach the problem. He introduced me to and helped me troubleshoot the fourier transform, which is a method for measuring the frequencies present in data - I was hoping that running this would allow me to see an increase in low frequencies when a train went by.
Unfortunately, this was not the case. Rather than seeing some particular frequency or set of frequencies spike as a train went by, tests with multiple datasets all showed a fairly even increase across all frequencies. Interesting, but not particularly valuable information when I could look at the raw data and see more-or-less the same thing. Another problem: running a fast fourier transform on ten seconds of data took significantly longer than ten seconds to process, and on a i7-5500. It wouldn't be feasible to run on a Pi.
So I set about devising my own method. As mentioned above, sensitivity was a must, but specificity is not - the use case for the software is only for when we are in bed, sleeping or soon to be so. Nobody is up and walking around, so the ability to distinguish between a train and someone's footsteps is not needed. With this in mind, I devised a relatively simple method to determine whether there was an ongoing seismic event. By keeping a running sum of the squares of the values for the last second, it was easy to calculate the root mean square (RMS) of the last second's worth of data as a measure of how much variance was present. Keeping a running queue of the values present over the last second, which I pushed onto and then shifted off of, I was able to accurately update the RMS with each new value quickly, without recalculating it from scratch. As I was sampling the microphone at 44100Hz, and then downsampling that data to 1/4th its original size, a one-second window is over eleven thousand values. Calculating a RMS of an 11000-member dataset, 11000 times per second, is not easily possible on a Raspberry Pi, but adjusting a running sum of squares reduced the amount of math necessary for each RMS update to just a handful of operations.
I learned about a statistical method called the cumulative sum (cusum), which allows for the detection of changes away from the mean in a dataset. By keeping track of the cusum of the RMS, I was able to detect changes in seismic signals that caused an increase in the variance of the data - such as a slowly increasing signal from a far-off train. I polished this data by writing a simple peakfinding algorithm to keep track of how long it had been since detecting a peak above a certain value based on the current RMS, to prevent some false positives. Then, every 0.6 seconds, I would increase the volume by one (percent, with a baseline of 50, up to 100) if the cusum detected a positive change in RMS in that time. To lower the volume after a train had passed, rather than detecting negative cusum changes, I simply had the volume decay by time - every 2.5 seconds, the volume is lowered by one percent. I tested the software with my recordings of trains and quiet periods, and graphing the different values.
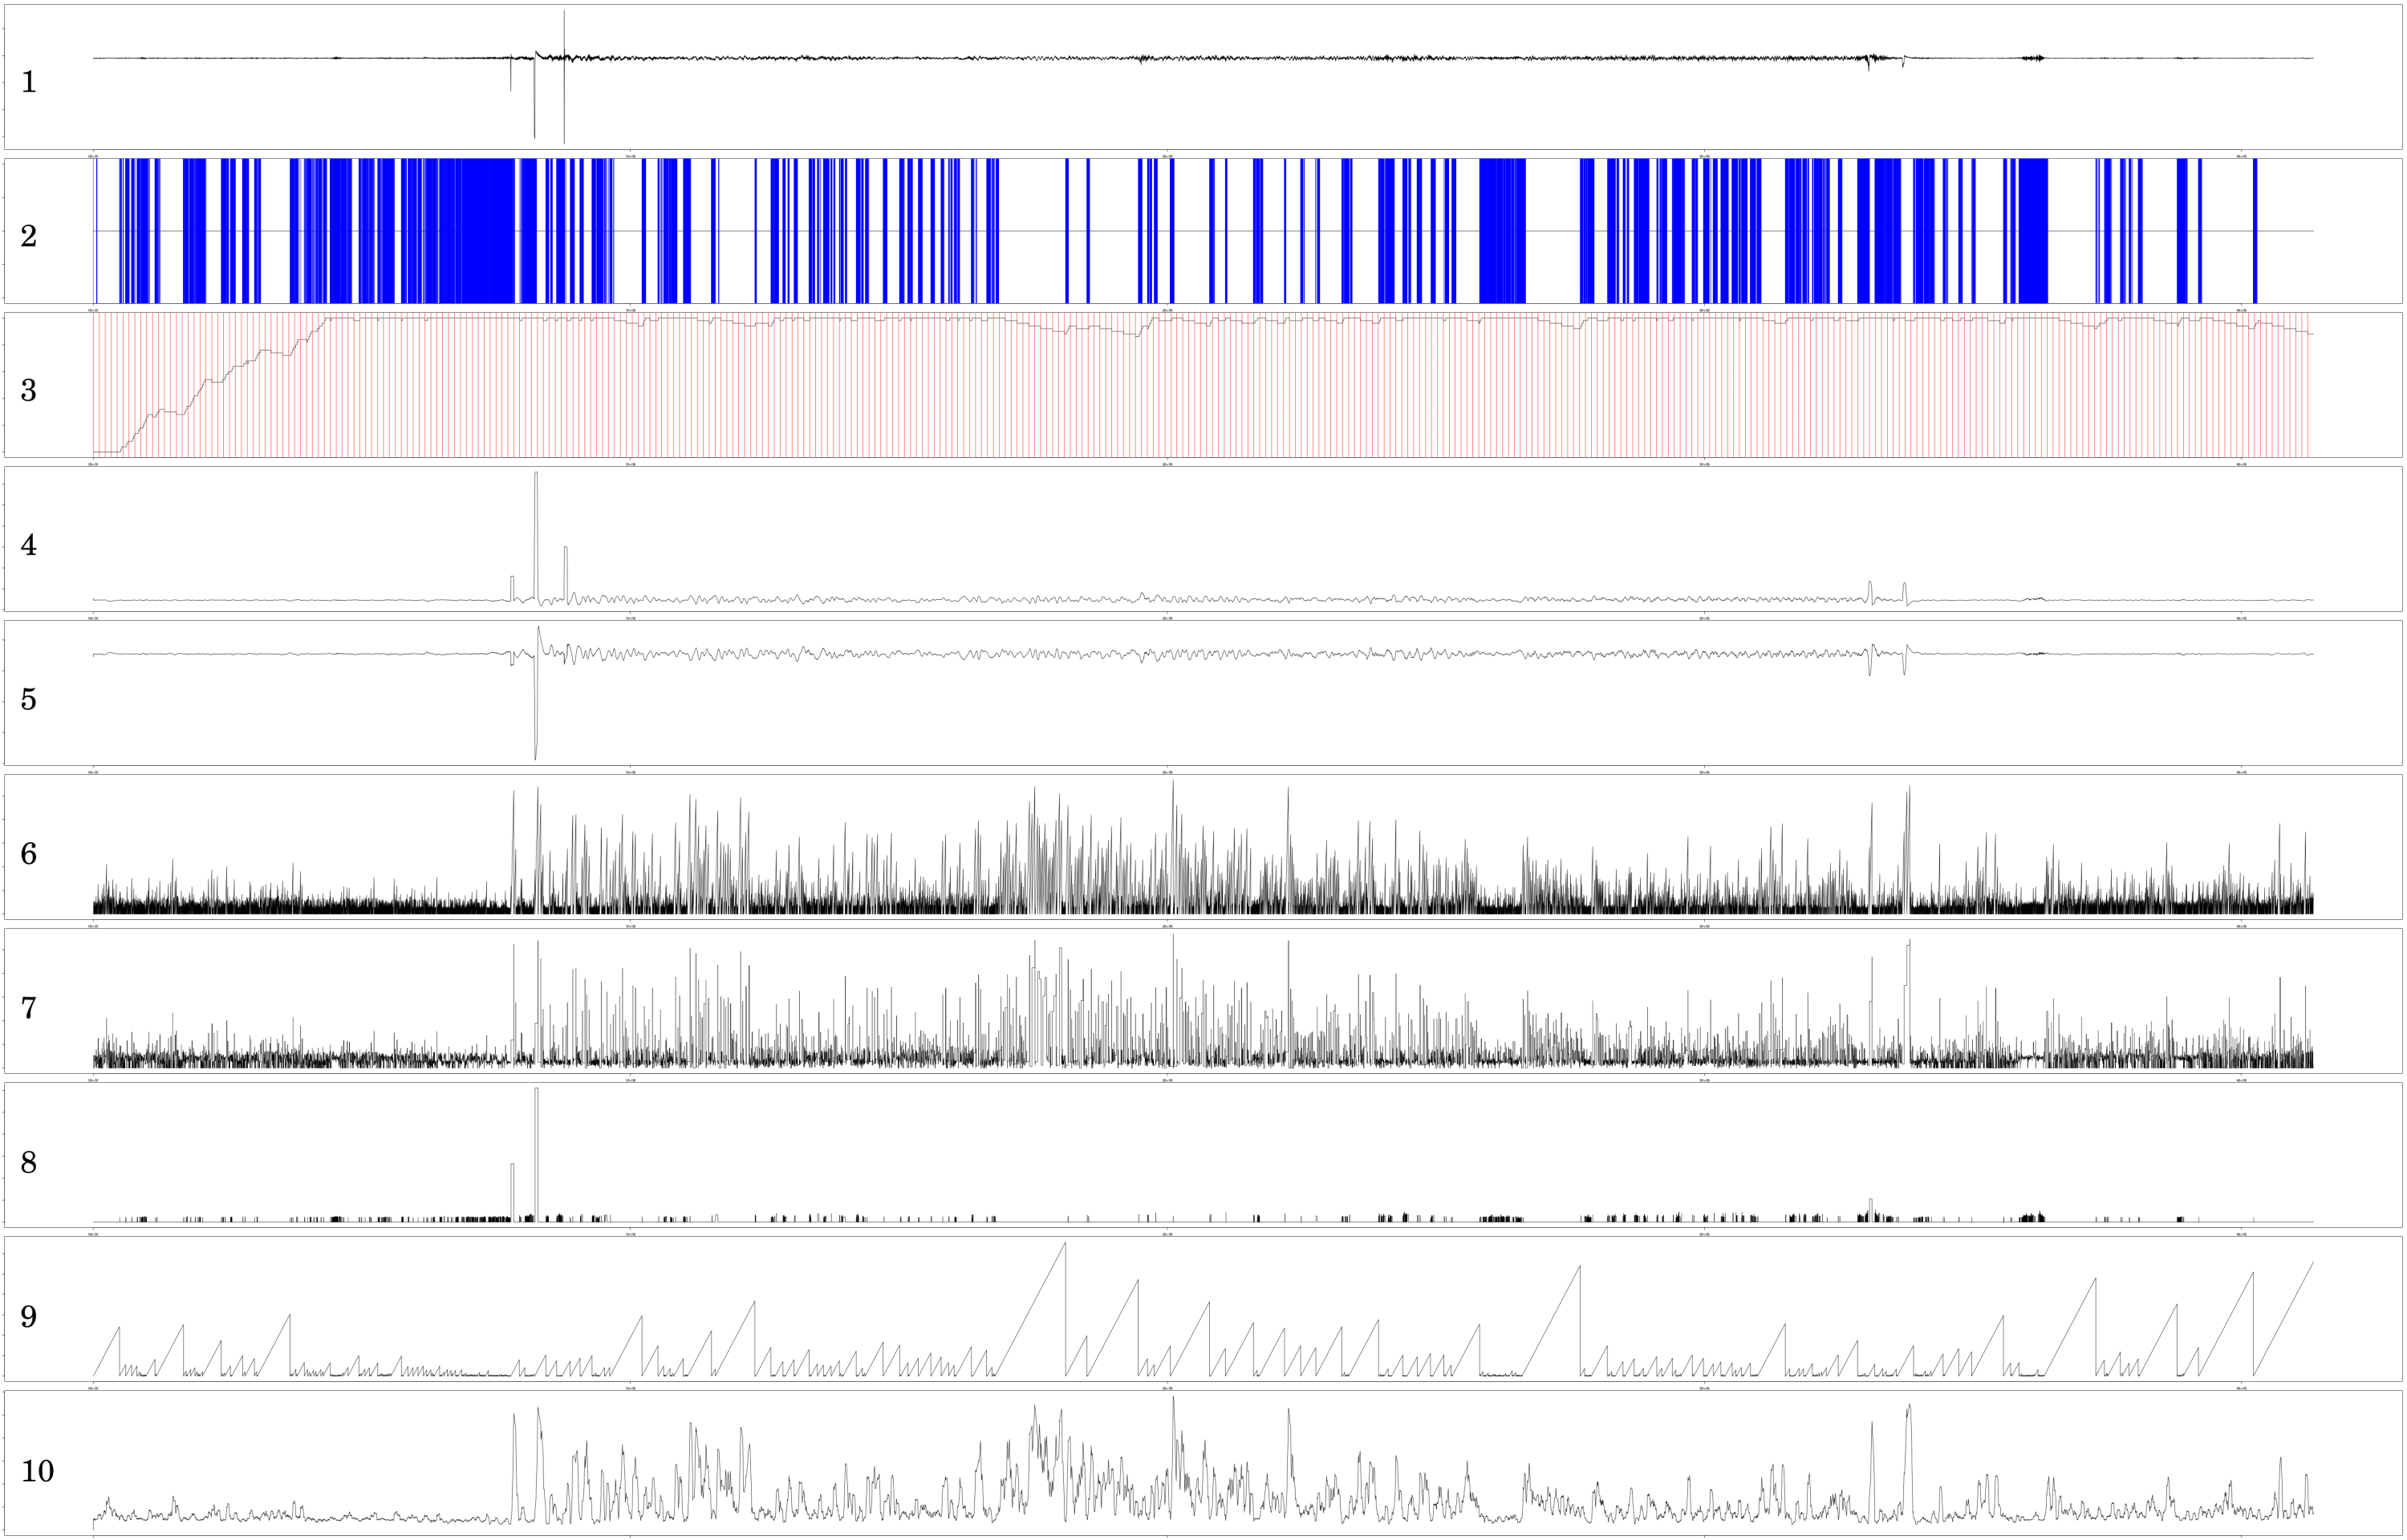
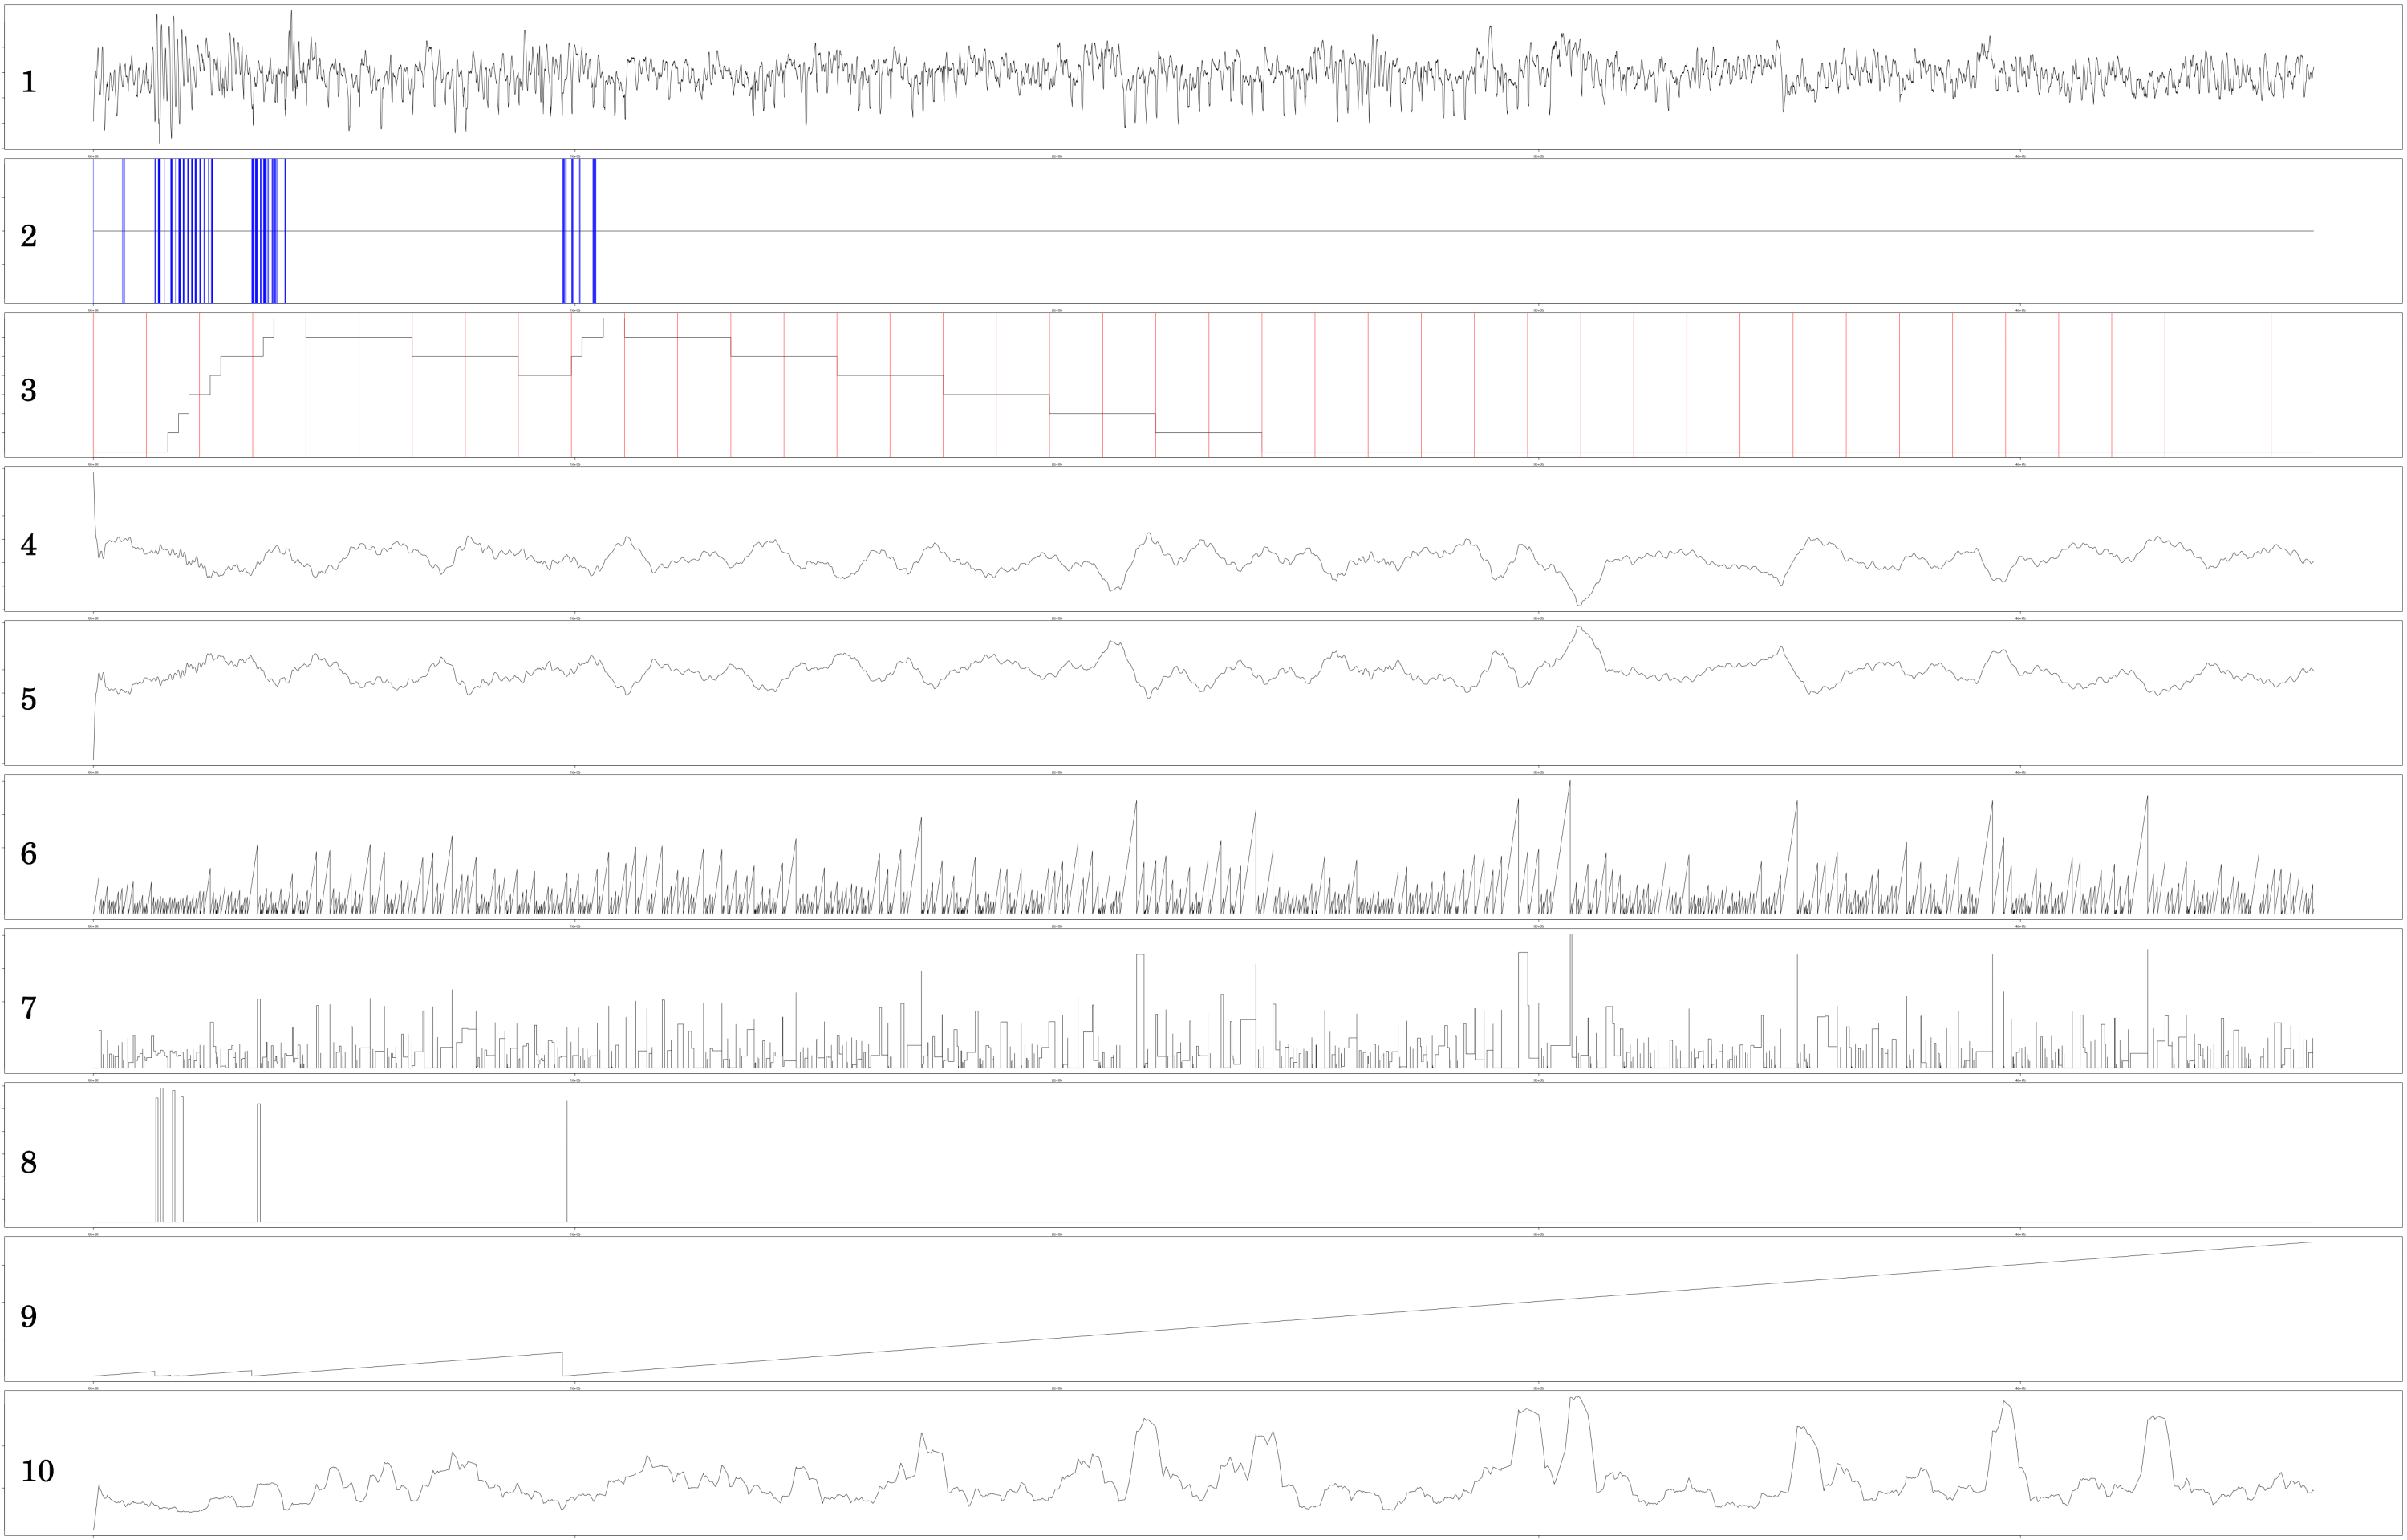
A recording of a train approaching and passing. The contents of each chart are as follows:
- The raw data off of the seismograph
- A vertical blue line represents a position where the cusum detected a positive RMS change
- A chart of the final volume value, from 50 to 100. A red line is drawn each 0.6 seconds, which is how often the volume value is updated
- A graph of the RMS across the last one-second window
- A graph of the mean value across the last one-second window
- The number of cycles since the last time the raw value crossed zero
- The number of cycles between the last two times the raw value crossed zero
- The absolute value of the last peak above threshold
- The number of cycles since the last value updated
- The mean value of (6) across the last half second
A recording of silence
Last Steps
While not perfect, this worked more than adequately to raise the volume when a train approached, keep it high as it went by, and then quiet itself down once the train had left. I had experimented with the breadboard, adjusted the amplification levels to the correct balance of sensitivity, and the whole end-to-end system was now complete. The last step was to solder the components together, for which I bought some solderable breadboards. I needed two smaller ones rather than one large, as I started with +/-12V power which was stepped down to +/-5v, necessitating four independent power rails plus ground. Once soldered, the project was complete, and we slept easy.